

A tool that I have always found fascinating is the spectrum analyzer, a tool that allows you to analyze a signal in the frequency domain, or to break down a complex signal into the simple signals that constitute it.
The first time I saw one inside a mix room I was mesmerized by the LED lights that turned on and off to the rhythm of the music, almost as if I were in front of a dance. And the memories went back to the acoustic lessons in which they spoke of the so-called "dance of particles" which occurs when air particles are stimulated and set in motion by the sound wave.
I still remember the device, a Audioscope model 2813, which was immediately appreciated for its simplicity and robustness, for its colored LEDs, for a spartan and practical aspect that inspired confidence. An instrument that allowed the display, in amplitude and frequency, of audio signals between 32 and 16.000 Hz divided in 28 band da 1/3 octave each. Faced with the spectral analysis, I had the impression that I was faced with something important that I could not, however, define.

Acoustic correction
One of the uses of an acoustic spectrum analyzer concerns, in addition to the analysis of audio signals, the measurement and correction of room acoustics. The theory is well known: if we generate a sound signal in which the energy is uniformly distributed over all frequencies, and then on the spectrum analyzer we visualize a frequency response that is not uniform, which is not "flat", well it will mean that those peaks and troughs correspond to sums, interferences, cancellations due to all the components of our system, and mainly to the sound reflections in the environment in which we find ourselves.
With a pilot plant graphic equalizer or parametric it will then be possible to correct the frequency response and make it return linear. Among the different types of signals used for this type of calibration we have the white noise, characterized by constant amplitude over the entire frequency spectrum. It is called white because electromagnetic radiation of a similar spectrum within the visible light band would appear to the human eye as white light, and is considered by some to be a soothing and relaxing sound.
Mostly used is the famous pink-noise (pink noise) structured in such a way as to compensate the sensitivity of the human ear to the various frequencies. In practice, pink noise contains all the frequencies of the audible spectrum, but with an intensity that decreases (as the frequency increases) at the rate of 3 dB per octave. It is also the type of signal that can be generated by the 2813 audioscope, via an XLR output.

This lower high frequency energy makes pink noise, compared to white noise, we could say, less "abrasive", less like the static hum of a radio and more like a rustle of leaves. For this reason it is also used as a soothing sound to aid nighttime sleep, or relieve tinnitus problems. However, the impression was that, regardless of the use we can make of it in the professional or amateur field, that analyzer wanted to communicate something to me.
Unity and multiplicity
What was important behind the spectral analysis? What was there to learn hidden behind that hypnotic sway of bright LEDs? We repeat again that it is an instrument that allows to decompose a complex wave into the simple waves of which it is made. So let's try to take a microphone and start talking or singing and see what happens: initially the story seems to get complicated because we started from a single element, that is the sound of our voice, and on the spectrum analyzer we see instead a whole series of oscillations separated from each other and changing over time.
On closer inspection, however, it is my voice that is a complex wave and the analyzer is telling me that, although complex, it is formed by the sum of simple waves all the same, which differ from each other only in terms of frequency and intensity. In fact, if now we take the sound of a great concert made up of a multitude of instruments, voices and sounds of all kinds, and we feed it to our analyzer, the situation will remain almost unchanged with the instrument that will still seem to tell us: you can feed me even the most complex sound in the world but I will always continue to show you that it is nothing more than the sum of simple waves, all the same, which differ only in frequency and intensity.

The analyzer seems to suggest, in other words, that sound reality (but also reality tout-court), although apparently very complex and made up of many separate and different elements from each other (a piano sound, for example, which is very different from that of a flute and even more so from the sound of the voice and / or the sound of the sea), is the result of sum of simple waves which constitute it, so that they are all similar if not, in a certain sense, equal to each other. A reality therefore less complex and differentiated than what appears.
Let's try to formulate this concept better: a small number of elements, combined together, produces all the complexity of the universe (sound in this case). An example to give the idea comes from the world of computer science: there are an infinite number of software, operating systems, applications of the most varied types in the world but all are written using the binary system consisting of just two values, 0 e 1.
In reality, however, this example is only partially fitting, because the idea we want to communicate is deeper. So let's try to see an image that shows the complex wave as the result of adding more simple waves.

What is surprising looking at the image is that the information relating to three simple waves, wave "a", wave "b", wave "c", and their relative sound sensations, coexist in the complex wave "d" in the same portion of space and time.
Let's try to clarify with an example that takes its cue from our ordinary perceptions, let's say we have a book that contains a certain number of information, which has a certain weight and a specific number of pages, well this book will occupy a certain space in our library and it will take some time to read it. If we then take two other similar books we will have in total about triple the weight, triple the space occupied in the library and it will take us triple the time to be able to read all three.
With sound (and more generally in the theory of waves) we have a very different situation, it is a bit as if we took the three books and threw them one on top of the other, obtaining a fourth book that has the same dimensions as a book single but containing the information of all three combined! This is explained by the fact that we are faced with one and only energy that vibrates, we can also say "moves", in different ways.
If the energy vibrates at a frequency, let's say 100 Hz we will have a given sound perception that will correspond to a certain sound (and to a certain series of luminous LEDs on the spectrum analyzer), if it vibrates at 1000 Hz we will perceive a different sound (with other LEDs that light up on the device) and if we are listening to a concert we are faced with the same energy that is vibrating in a much more complex, rich and exciting way for us.
The spectrum analyzer was perhaps showing me the illusion of separation (between sounds in this case). After all, my voice was always the same, one and only, regardless of how many frequencies I saw swaying on the device's LEDs. Over time I have come to believe that this is not only true of sound, but of reality in general. A single and great energy (which we could define as Totality) vibrates and moves in infinite different ways, and on the degree of activity of the vibrations specific perceptions and the apparent separation between all things depend. So, for example, if we move from the audible to the visible spectrum with much smaller frequencies and wavelengths (wavelengths on the order of nanometers), perceptions of light and colors come into play.

Fourier transform
The mathematical process used to break down a complex wave into its constitutive frequencies is known as Fourier transform. When a function represents a physical phenomenon, such as electromagnetic or acoustic, this function is called a "signal", and the Fourier transform constitutes the "spectrum" of this signal. In practice, the Fourier transform allows to calculate the different components (amplitude, phase and frequency) of sinusoidal waves which, when added together, give rise to the starting signal.
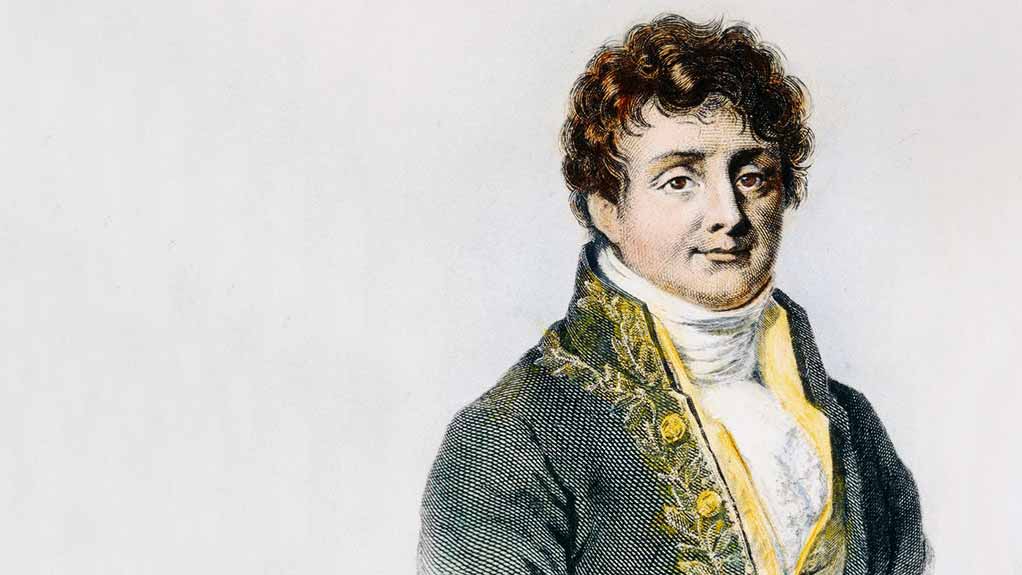
An idea born from the brilliant mind of Jean Baptiste Joseph Fourier, French mathematician and physicist born on March 21, 1768 in Auxerre, and died in Paris in 1830. Fourier's analysis challenged the mathematical theories to which several of his illustrious contemporaries adhered who rejected his theses. Despite these contrasts, the French Academy of Sciences could not ignore the extent of his results and awarded him a prize which was nevertheless granted him with the following reservation: "The novelty of the subject, together with its importance, prompted us to crown this works, but we cannot fail to observe that the way in which the author arrives at his equations is not without difficulties and that his analytical method for integrating them leaves something to be desired in terms of generality and rigor ”.
The distrust with which colleagues viewed his work delayed its publication until 1822, when Fourier published his main work entitled Analytic theory of heat. In any case, time seems to have done him justice since the homonymous crater on the Moon was named after him, and his is one of the 72 names of French citizens reported on the Eiffel Tower.
His work begins with these introductory words: "the primordial causes are unknown to us, but these are subjected to simple and constant laws, which can be discovered through observation, and the study of which constitutes the object of the philosophy of nature".
The Fourier Transform is widely used in mathematics, physics, engineering, but cannot be used for "real-time" applications due to the large number of mathematical operations required (and the consequent computational weight). Fortunately, in 1965 two researchers (Cooley and Tuckey) drastically reduced the number of mathematical operations required to perform the Fourier transform through the development of an algorithm called Fast Fourier transform (FFT), which makes real-time signal-to-frequency conversions and digital audio analysis possible in today's plug-ins used in audio software and DAWs.
Spectrogram
Among the tools that use this algorithm there is also the spectrogram. The term spectrogram means the graphic representation of the intensity of a sound as a function of time and frequency, representation in which:
-on the ordinate axis (Y) the time is reported (in linear scale),
- on the abscissa axis (X) the frequency is reported (in logarithmic scale);
- each point of the Cartesian coordinates is assigned a shade of gray, or a color, representing the intensity of the sound at that instant of time and at that frequency.
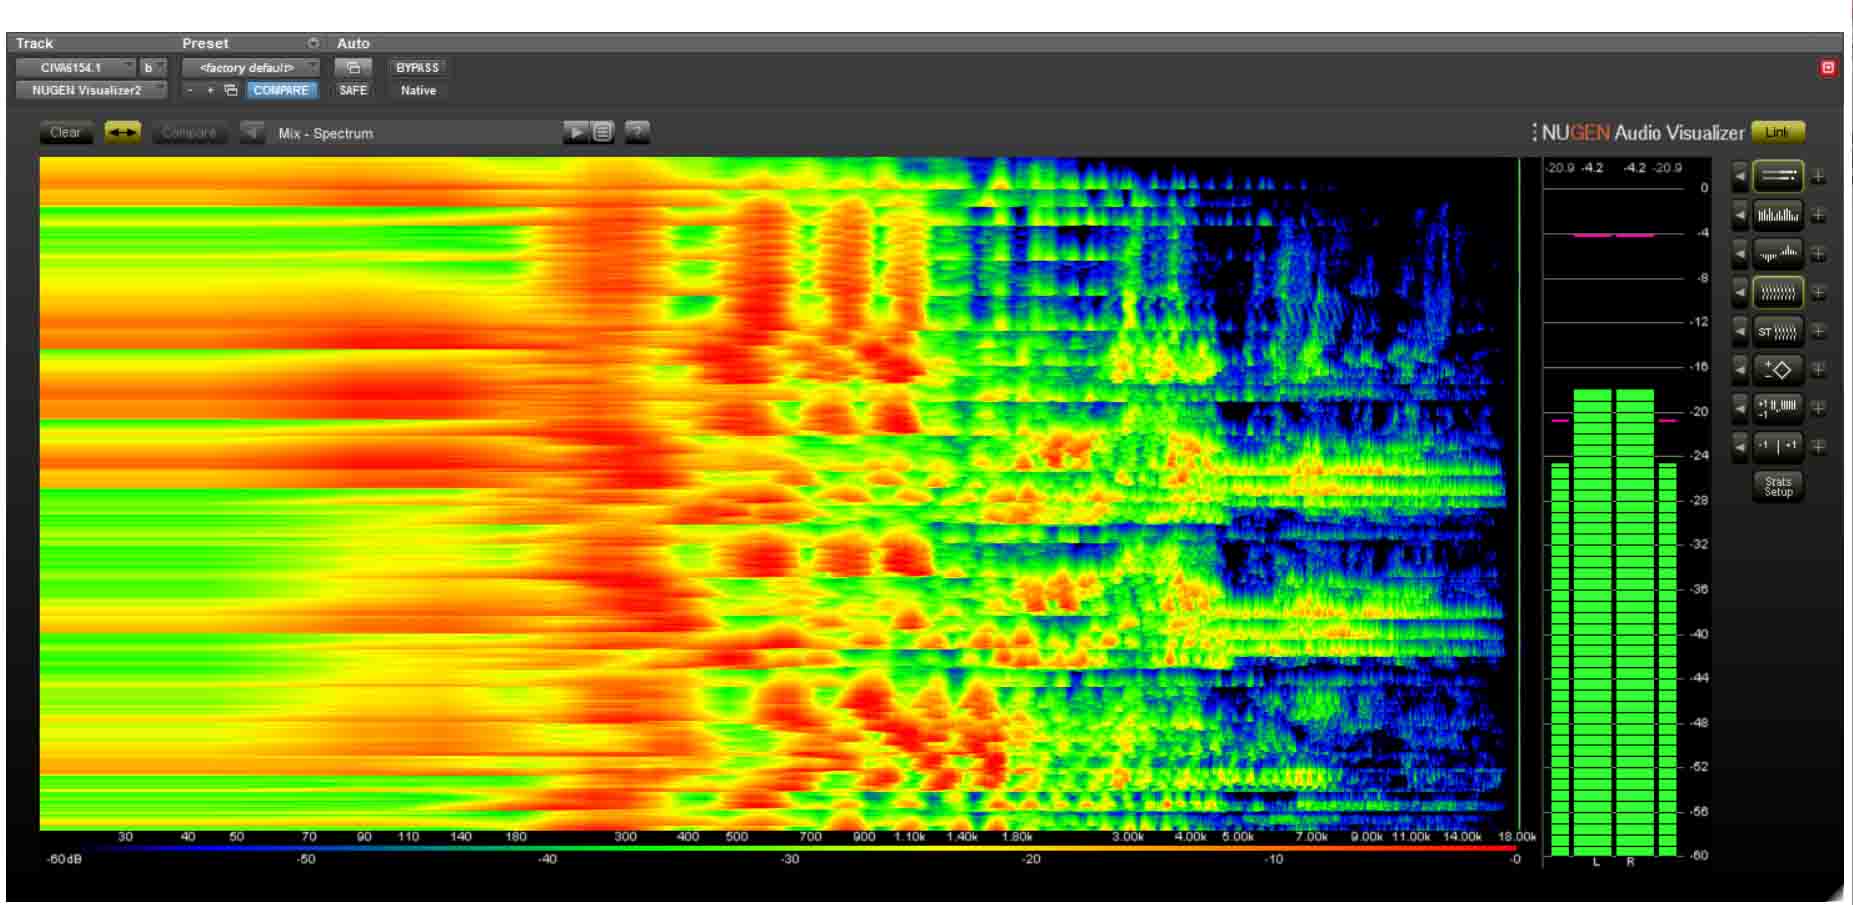
In practice, where a spectrum analyzer shows the amplitude (Y axis), one spectrogram shows you the time, the width is shown in color instead. In this way, a spectrogram is able to show a history of the graphic evolution of the sound over time, and also allows to visualize some aspects or characteristics of the sound that cannot be visualized with the help of other instruments. For example, in the image above you can see a vertical yellow line around the image on the right of the image (just before the meter) 18kHz. This is an unwanted high-frequency (hardly audible) sound, a hiss or hum that we were not aware of prior to our spectral analysis.
Moving on to considerations of a more general and conclusive nature: our reflection concerns the way in which what is unitary shows itself to be multiple. And how from multiplicity we can return to the One, understood as an absolute principle. This approach involves the idea of an interconnection between everything that exists, including seemingly very different and distant elements of the real world.
The study of sound lends itself to this type of investigation, because in the world and in the manifest universe that we know (and of which we are a part) everything is in a certain sense a "vibration", an undulatory movement of energy. This conception of reality is certainly not new and indeed, we could say it has been handed down from the most remote times and is present in the tradition of countless peoples of the past, just think, in the Philosophy of Ancient Greece, of Aristotle's Metaphysics which describes the real world as constituted by continuous movements and changes, movements which are determined by causes which in turn are subject to movements and changes.
It is the same idea of a universe made up of vibrations, which go in all directions, crossing, bumping, becoming stronger or weaker, stopping or strengthening each other and so on. An idea that is based on the profound unity of reality, with all things and living beings connected in a visible and invisible way, and which establish a communication between them in all planes of existence through vibrations.
It should be emphasized that quantum physics is going in the same exact direction, showing us bonds between particles so intrinsic that any action or measure on the first has an instantaneous effect on the second as well (and vice versa) even if they are located at a great distance (quantum entanglement) .
This also entails the need, on an individual level, to tune in to the subtlest, most refined, noble frequencies of reality, but we refer to other occasions to deepen these issues that are very close to our heart. As we also care, when we deal with sound, and when this is possible, do not neglect those aspects of the sound phenomenon that can lead us to a clearer and deeper understanding of the real world.